

Despite declining economic activity, silver prices declined. As minutes from the Federal Reserve’s June and July meetings projected future 50-basis-point rate rises, gold prices declined. Due to sluggish economic development, the dollar remains at its one-month low.
In response to major economic data, benchmark yields were relatively stable today. As investors continued to evaluate the most recent news, the yield on ten-year bonds dipped modestly.
As EU negotiators tighten their grip on a deal, the likelihood of a ban on Russian oil imports increases, and the oil market maintains its upward pace. A larger-than-anticipated reduction in US crude oil stocks also drove up prices last week.
The first-quarter GDP fell by 1.5 percent, which was worse than the anticipated decrease of 1.3 percent. The GDP decline is the worst since the second quarter of 2020, during the height of the epidemic. The GDP estimate implies a greater economic downturn than forecasters anticipated.
Private inventories and residential investment were revised downward, which offset the 3.1% increase in consumer spending. Due to global concerns and the omicron version, economists anticipate a better performance in the second quarter.
Technical Evaluation
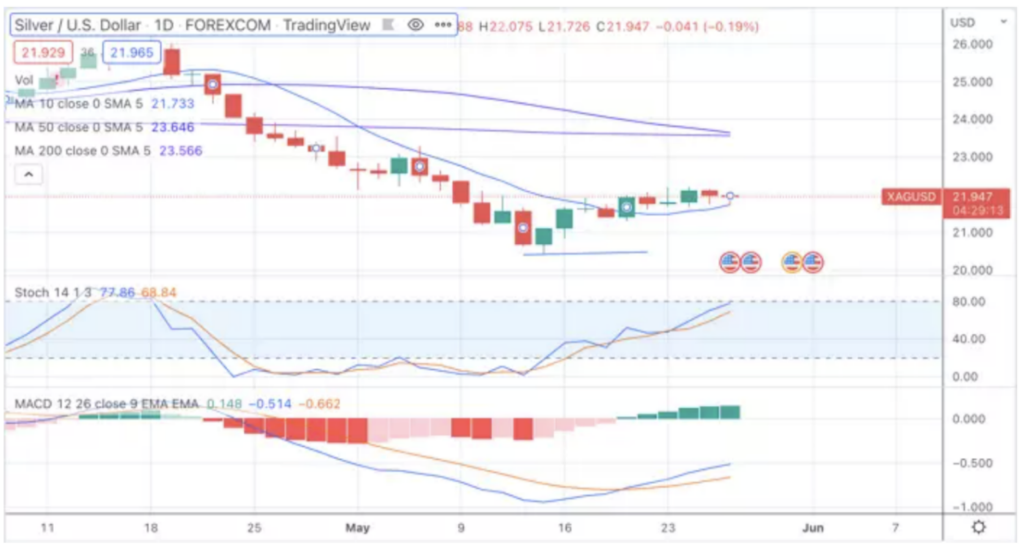
The price of silver tests the 10-day moving average of 21.7, before falling to approach its weekly low and staying just below $22. Investors remain cautious on XAG/USD as minutes from the Federal Reserve predict aggressive rate hikes, which supports the dollar.
When silver prices breach support, they will continue to decline until they reach the $20.4 level, which was reached on May 13th.
Near the 10-day moving average of $21.607, there is support. Near the May 6 highs of 22.6 there is resistance. The short-term momentum is bullish, since the fast stochastic signaled a buy crossing.
The medium-term momentum turns positive when the histogram and MACD both show positive values (moving average convergence divergence). The MACD histogram is moving in a positive direction, indicating an upward trend in price movement.