

Due to poor economic statistics, increasing inflation, and Fed comments in line with forecasts, gold prices remain stable. The minutes of the Fed’s June and July meetings suggested future 50-basis point rate rises, which might support a firmer currency.
The increase in stocks is bearish for gold. The dollar stands at its lowest level in a month as economic growth slows. In response to important economic data, benchmark yields stayed relatively unchanged today. As investors continued to evaluate the most recent news, the yield on ten-year bonds dipped modestly.
The first-quarter GDP declined by 1.5 percent, which was worse than the anticipated loss of 1.3 percent. The GDP decline is the worst since the second quarter of 2020, during the height of the epidemic. The economic downturn will likely be more severe than anticipated by economists.
Private inventories and residential investment were revised downward, offsetting the 3.1% increase in consumer spending. Due to global concerns and the omicron version, economists anticipate a better performance in the second quarter.
Technical Evaluation
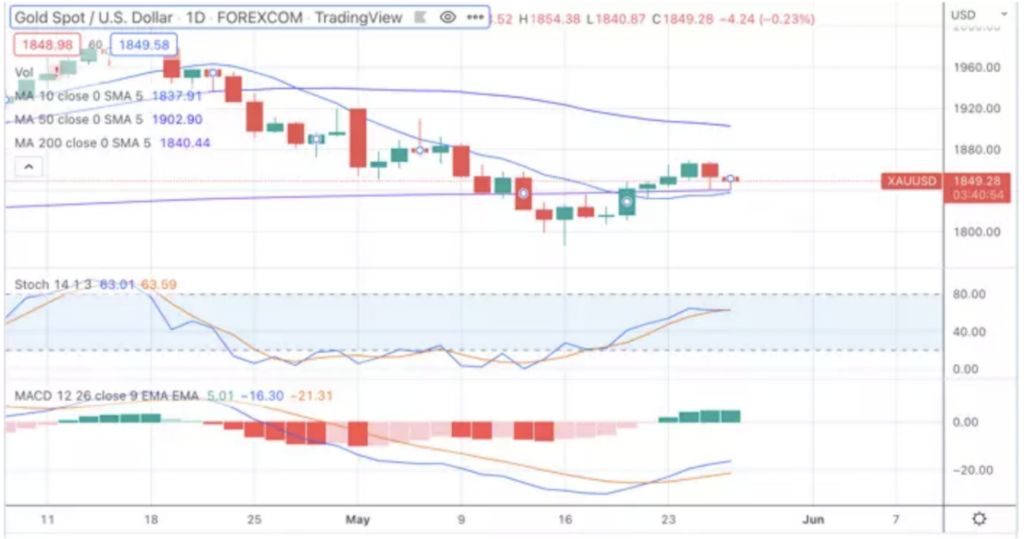
Despite a downward trend, gold prices remain above the 200-day moving average of $1840, trading at $1850. The weekly decline may provide optimistic traders with an opportunity to buy the dip, given that inflation remains persistent and economic growth is slowing, which might counter a Fed rate hike that could reverse bias.
At 1837, there is support near the 200-day moving average. Near the 50-day moving average near 1903, resistance is observed.
As the Fast Stochastic produced a crossing sell signal, short-term momentum became negative. As the fast stochastic reaches 63.03, prices are no longer oversold and are approaching the overbought trigger level of 80.
As the MACD may provide a crossing buy signal, medium-term momentum turns positive. This occurs when the 12-day moving average minus the 26-day moving average crosses below the MACD line’s 9-day moving average. The trajectory of the MACD (moving average convergence divergence) histogram is negative, indicating falling prices.